A Projection Welding Parameters Chart provides the recommended welding settings needed to produce consistent, high-strength welds across different materials, projection designs, and part thicknesses.
Using the correct combination of welding current, weld time, electrode force, and hold time is essential for achieving proper fusion while preventing common defects such as expulsion, weak weld nuggets, excessive indentation, electrode wear, and costly rework.
Because projection welding concentrates heat at raised contact points, even small parameter deviations can affect weld quality, dimensional accuracy, and production efficiency.
Whether you’re setting up a new resistance welding operation, optimizing an existing process, or troubleshooting inconsistent results, understanding the values in a projection welding parameters chart helps improve process stability and inspection reliability.
I’ll explain how to interpret these recommended settings and apply them effectively in real manufacturing applications.
Understanding Projection Welding Fundamentals
How Projections Concentrate Heat and Force
Projection welding uses raised features—embossed, machined, or formed—on one workpiece to focus electrical resistance and electrode force at specific points. This localization generates rapid heating at the faying surface while the surrounding material stays cooler.
Unlike spot welding, the projections collapse under force, creating a larger fused zone with better mechanical properties for applications like attaching weld nuts, studs, or cross-wire joints.
Key advantage: multiple projections can be welded simultaneously if current distribution and force follow-up are balanced. Heat generation follows Joule’s law (I²Rt), where current density at the projection tip drives melting before full collapse.
Material and Projection Design Factors
Projection geometry (base diameter Dp, height H, and top diameter) must match material thickness and type. For low-carbon steel, standard embossed projections follow guidelines where Dp scales with thickness—typically 1.5–2 times sheet thickness for single projections. Height H is often 0.5–1.5 mm to allow controlled collapse without expulsion.
Stainless steels require higher currents due to higher resistivity but narrower parameter windows to avoid sensitization. Aluminum demands higher currents and shorter times because of its low resistivity and rapid heat dissipation, plus careful oxide management.
Core Projection Welding Parameters Explained
Welding Current: Balancing Heat Input
Current is the primary driver of nugget formation. Start with values per projection and scale for multiples. For mild steel sheet around 1.5–2 mm with standard projections: 10,000–15,000 A total is common. Per projection, aim for 8–12 kA depending on size.
Higher currents accelerate heating but risk expulsion if force follow-up lags. Lower currents with longer times suit thicker sections or heat-sensitive materials. Inverter or MFDC machines allow better control than AC for fine tuning. Always verify with a weld monitor measuring actual delivered current, as secondary impedance (cables, shunts) reduces output.
Electrode Force and Follow-Up Dynamics
Force ensures contact, collapses the projection cleanly, and forges the nugget. Typical ranges: 300–600 N per projection for thin sheets, scaling up to several kN for larger nuts. For a 2 mm mild steel sheet, 500–800 N total often works well.
Insufficient force causes spitting and weak bonds; excessive force flattens projections prematurely without fusion. Critical is dynamic follow-up—the machine’s ability to maintain force as the projection collapses in milliseconds. Pneumatic systems need low-friction heads; servo systems excel here. Poor follow-up is a top cause of inconsistent set-down.
Weld Time and Cycle Control
Weld time (typically 5–30 cycles or 10–100+ ms) controls heat duration. Shorter times with higher currents minimize heat-affected zones (HAZ) and distortion. For mild steel: 10–20 ms common. Hold time (post-weld) allows solidification under force, usually 5–15 cycles.
Squeeze time ensures full force before current flows. Pre-pulse or upslope routines help with coated materials by breaking surface oxides gradually.
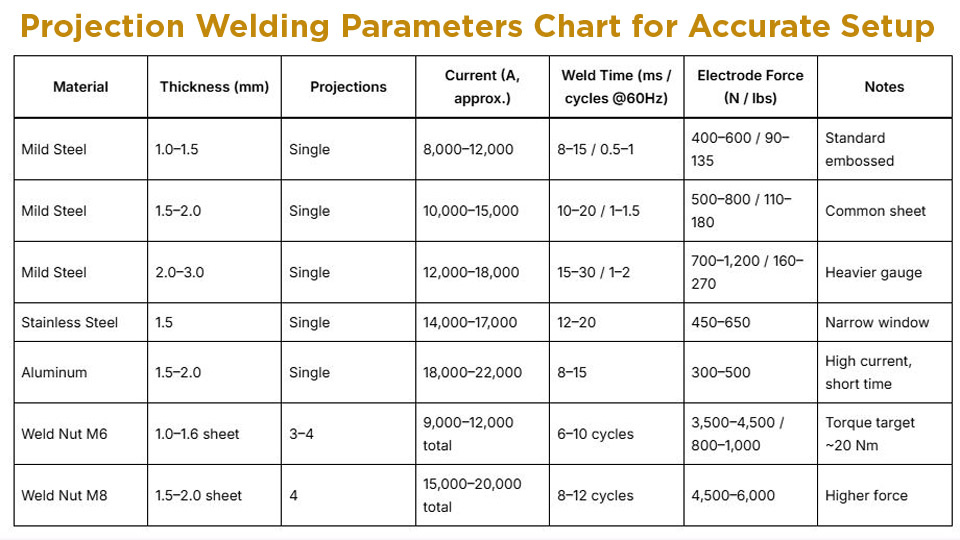
Projection Welding Parameters Chart: Practical Reference Data
Use these as starting points only. Always perform weld qualification tests (tensile, torque, peel) and adjust for your machine, electrodes, and exact materials. Values assume clean, scale-free low-carbon steel unless noted.
| Material | Thickness (mm) | Projections | Current (A, approx.) | Weld Time (ms / cycles @60Hz) | Electrode Force (N / lbs) | Notes |
|---|---|---|---|---|---|---|
| Mild Steel | 1.0–1.5 | Single | 8,000–12,000 | 8–15 / 0.5–1 | 400–600 / 90–135 | Standard embossed |
| Mild Steel | 1.5–2.0 | Single | 10,000–15,000 | 10–20 / 1–1.5 | 500–800 / 110–180 | Common sheet |
| Mild Steel | 2.0–3.0 | Single | 12,000–18,000 | 15–30 / 1–2 | 700–1,200 / 160–270 | Heavier gauge |
| Stainless Steel | 1.5 | Single | 14,000–17,000 | 12–20 | 450–650 | Narrow window |
| Aluminum | 1.5–2.0 | Single | 18,000–22,000 | 8–15 | 300–500 | High current, short time |
| Weld Nut M6 | 1.0–1.6 sheet | 3–4 | 9,000–12,000 total | 6–10 cycles | 3,500–4,500 / 800–1,000 | Torque target ~20 Nm |
| Weld Nut M8 | 1.5–2.0 sheet | 4 | 15,000–20,000 total | 8–12 cycles | 4,500–6,000 | Higher force |
For detailed low-carbon steel projection design data (Dp, H, electrode face sizes), refer to industry tables showing fused zone diameters scaling with thickness.
Optimizing Parameters for Specific Applications
Welding Fasteners: Nuts, Studs, and Bolts
For weld nuts, projections are often annular or discrete on the nut base. Parameters prioritize torque and push-out strength over cosmetic appearance. Example for M6 on 1.2–1.6 mm steel: ~10–11 kA, 4–6 kN force, 6–10 cycles. Ensure electrode alignment with locating pins to center force.
Multi-projection setups require current sharing calculations—divide total available by number of projections but account for imbalances. Test for set-down: aim for near-complete collapse with minimal gap (<0.3 mm typical) while avoiding cracking.
Cross-Wire and Sheet-to-Sheet Projection Welding
In cross-wire (e.g., mesh or fencing), round wire intersections act as natural projections. Parameters depend on wire diameter: smaller wires need lower force and current to avoid flattening. Sheet-to-sheet with multiple embossed projections demands uniform projection height (±0.1 mm) for even current distribution.
Handling Coated and Dissimilar Materials
Galvanized steel needs adjusted schedules—often higher initial force or pre-pulses to manage zinc vaporization and reduce porosity. Stainless-to-mild steel combinations require balancing heat (more current to the higher resistivity side).
Aluminum-to-steel is challenging due to intermetallics; specific parameter windows and sometimes transition materials are used.
Machine and Tooling Considerations for Parameter Success
Equipment Capabilities and Setup
Machine kVA rating must deliver required current without voltage drop. Press-type machines with rigid frames and good follow-up perform best. Monitor secondary current and force waveforms during setup. Electrode material (RWMA Class 2 or 3) and face diameter affect current density—larger faces for distributed force.
Electrode Maintenance and Alignment
Flat, aligned electrodes prevent skidding and uneven loading. Dress regularly to maintain surface condition. Misalignment causes preferential heating on one side of multi-projection parts.
Troubleshooting Parameter-Related Issues
Common Defects and Adjustments
- Expulsion/Spatter: Increase force, reduce current, or shorten time. Improve follow-up.
- Weak or No Weld: Increase current/time or check projection integrity and contact.
- Excessive Indentation or Burning: Reduce current or increase force.
- Inconsistent Set-Down: Address machine inertia, friction, or projection variation.
- Thread Distortion on Nuts: Shorten weld time, increase force.
Destructive testing (torque, tensile shear) and non-destructive (visual, ultrasonic) validation are essential. Use weld lobe curves to map acceptable parameter ranges.
Advanced Parameter Development
Develop schedules systematically: start conservative, vary one parameter at a time, and document with peel tests or sectioned macros. Modern controls with constant current feedback and displacement monitoring help maintain consistency across production runs. For critical applications, validate against standards like AWS or ISO for projection welds.
Wrapping Up
Mastering a projection welding parameters chart and adapting it through methodical testing leads to repeatable, high-strength joints that outperform generic settings.
Treat every new combination of material, projection design, and machine as a unique system—optimize around measured collapse distance, actual current delivery, and verified mechanical performance rather than published nominals alone. This data-driven approach separates reliable production from constant rework.
FAQ: Projection Welding Parameters
What is the typical current range for projection welding mild steel sheet?
For 1.5–2 mm mild steel, expect 10,000–15,000 A depending on projection count and size. Always scale and test for your specific setup.
How does electrode force affect projection collapse?
Higher force promotes faster, cleaner collapse and better forging but can squash projections before sufficient heating. Balance with current and time for optimal nugget formation and set-down.
Why do my projection welds vary in strength batch to batch?
Common causes include projection height inconsistency, electrode wear, poor force follow-up, material surface variations (scale, coatings), or secondary impedance changes. Maintain tight process controls and monitor waveforms.
Can the same parameters be used for stainless steel as mild steel?
No—stainless typically requires 20–40% higher current, adjusted force, and careful timing due to different resistivity and thermal properties. Narrower acceptable ranges increase the need for precise control.