Understanding what is the deposition rate in welding is essential when evaluating welding productivity, filler metal efficiency, and overall project cost. Deposition rate refers to the amount of weld metal deposited over a specific period, typically measured in pounds or kilograms per hour.
It directly affects fabrication speed, labor requirements, and process selection for both light-duty and heavy industrial applications.
Choosing a welding process with the wrong deposition rate can increase production time, waste filler material, and reduce overall efficiency, even when weld quality meets specification.
Whether you’re comparing MIG, FCAW, SAW, or stick welding, knowing how deposition rate is measured and what influences it helps you make better decisions for both performance and cost.
A clear understanding of this concept allows you to optimize welding operations while maintaining the required weld quality and productivity.
Image by welderdestiny
How Deposition Rate Differs from Melt-Off Rate
Melt-off rate measures total filler metal consumed. Deposition rate measures only the portion that becomes solidified weld metal. The difference is deposition efficiency.
Efficiency Losses Across Common Processes
SMAW efficiency typically falls between 60–65 percent because of slag, spatter, and the unusable electrode stub. GMAW solid-wire efficiency ranges from 92–98 percent depending on transfer mode and shielding gas. FCAW averages near 85–90 percent.
SAW and GTAW (with filler) approach 99 percent. A published melt-off of 12 lb/hr at 90 percent efficiency yields only 10.8 lb/hr of actual weld metal. Ignoring this conversion leads to incorrect labor estimates and oversized joint designs.
Why the Distinction Drives Cost and Schedule
Every percentage point of efficiency multiplies across hundreds of feet of weld. On a 500-foot structural job requiring 8 lb of deposited metal per foot, a 10-point efficiency drop adds roughly 400 lb of extra consumable plus the associated arc time. Fabricators who quote from melt-off figures systematically understate both material and labor cost.
Calculating Deposition Rate for Wire-Fed Processes
Wire processes allow direct calculation because wire feed speed remains constant under constant-voltage control.
Solid Steel Wire Formula
For carbon-steel and most stainless solid wires the practical formula is:
Deposition rate (lb/hr) = 13.1 × (D)² × WFS × EE
D is electrode diameter in inches, WFS is wire feed speed in inches per minute, and EE is deposition efficiency expressed as a decimal. Example: 0.045-inch wire at 400 ipm with 0.95 efficiency yields approximately 10.1 lb/hr. Aluminum uses a lower constant near 4.3 because of density differences.
Applying the Formula to Flux-Cored Wire
Flux-cored wires follow the same structure once the manufacturer’s published efficiency or a measured value (commonly 0.85–0.90) is inserted. Larger diameters and higher feed speeds push rates into the 12–20 lb/hr range under spray or buried-arc conditions. Always verify against the specific wire data sheet; core composition alters both density and efficiency.
Process-by-Process Deposition Rate Realities
Each process occupies a distinct productivity band that dictates where it remains competitive.
SMAW Practical Limits
Manual SMAW with 1/8-inch or 5/32-inch electrodes deposits 1.5–4.5 lb/hr under normal shop conditions. Operating factor rarely exceeds 25–35 percent because of electrode changes and slag removal.
Higher currents increase melt-off but also increase stub loss and spatter, so net deposition gains remain modest. SMAW stays viable for field repairs and restricted access, not for high-volume production.
GMAW and FCAW Working Ranges
GMAW with 0.035–0.045-inch solid wire typically delivers 4–12 lb/hr at realistic operating factors of 40–60 percent. Spray transfer at higher currents and larger diameters can exceed 15 lb/hr.
Gas-shielded FCAW routinely reaches 8–18 lb/hr; self-shielded versions trade some efficiency for outdoor capability. Both processes benefit from continuous wire feed, which removes the stop-start penalty of SMAW.
SAW High-Output Capability
Submerged-arc welding on 3/32-inch to 1/8-inch wire or strip electrodes commonly deposits 15–40 lb/hr and can exceed 50 lb/hr in multi-wire or tandem setups. Operating factors often exceed 80 percent because the process is mechanized. SAW dominates long seams on heavy plate, vessels, and structural members where joint access and position allow.
Current, Wire Diameter, and Wire Feed Speed Trade-offs
Raising amperage or wire diameter increases deposition rate, but the relationship is not linear once transfer mode or arc stability limits appear.
Diameter Selection Effects
Moving from 0.035-inch to 0.052-inch solid wire at constant current density roughly doubles cross-sectional area and therefore deposition potential. The same principle applies to flux-cored and submerged-arc wires.
Larger diameters require higher minimum currents to achieve stable transfer; below that threshold the arc becomes unstable and efficiency drops.
Wire Feed Speed as the Primary Control
Under constant-voltage control, deposition rate scales directly with wire feed speed once efficiency is fixed. Doubling WFS doubles theoretical deposition, provided the power source can deliver the required current and the joint can accept the resulting heat input without excessive distortion or incomplete fusion.
Impact of Operating Factor on Actual Shop Output
Published deposition rates assume 100 percent arc-on time. Real shops rarely achieve that.
Converting Published Rates to Realistic Output
A flux-cored wire rated at 18 lb/hr at 100 percent duty produces only 5.4 lb/hr at a 30 percent operating factor. Operating factor includes fit-up, positioning, slag removal, and electrode or nozzle changes. Shops that track actual arc-on percentage can convert catalog numbers into accurate labor hours and consumable forecasts.
Position and Joint Design Constraints
Vertical and overhead positions force lower currents and slower travel speeds, cutting deposition rate by 20–40 percent compared with flat welding. Narrow groove joints with limited access further restrict high-deposition techniques. Joint design that favors flat or horizontal positions and allows continuous travel maximizes realized deposition.
Balancing Deposition Rate Against Heat Input and Weld Quality
Higher deposition usually raises heat input unless travel speed increases in proportion.
Heat Input Relationship
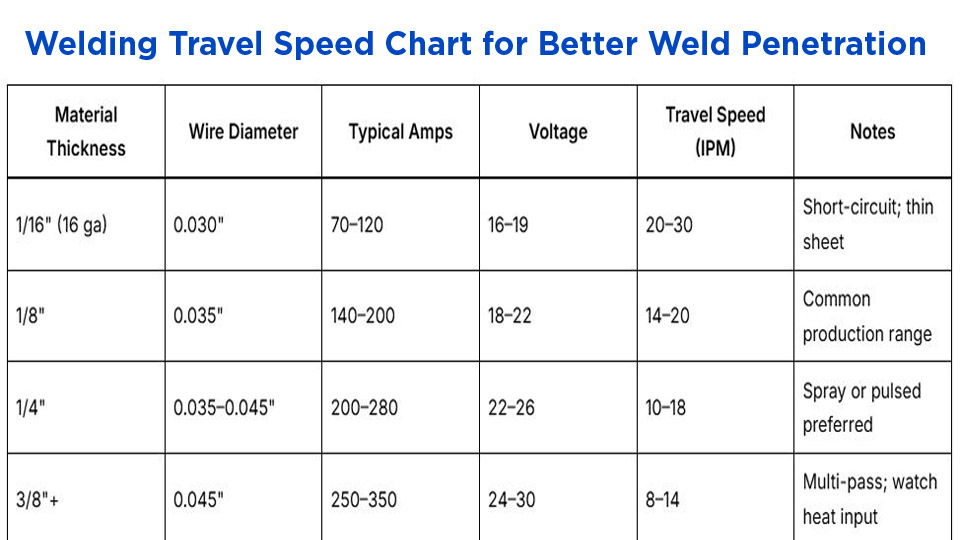
Heat input (kJ/in) = (V × A × 60) / (travel speed × 1000). Increasing current to raise deposition while holding travel speed constant elevates heat input, which can coarsen grain structure, increase distortion, and reduce toughness in the heat-affected zone. Matching travel speed to the new deposition rate keeps heat input within procedure limits.
Quality Limits on Maximum Rate
Excessive deposition in a single pass produces large weld pools that are difficult to control, especially out of position. Incomplete fusion at the toes, slag entrapment, and solidification cracking become more likely. Procedure qualification records and essential variables set the practical upper boundary for each process and joint.
Decision Framework for Selecting Target Deposition Rate
Match the required deposited weight per foot of joint to the process capability and available operating factor. Calculate the theoretical hours at 100 percent arc-on time, then divide by the realistic operating factor to obtain calendar time. Compare consumable cost and labor cost across candidate processes.
When distortion or mechanical properties constrain heat input, accept a lower deposition rate rather than risking rework. For high-volume flat work, prioritize SAW or large-diameter FCAW; for mixed-position field work, accept the lower rates of SMAW or self-shielded FCAW.
Wrapping Up
Selecting the correct deposition rate is a quantitative decision that links process choice, parameter settings, and joint design to measurable output. Shops that treat the number as a fixed catalog value rather than a variable controlled by efficiency, operating factor, and heat-input limits consistently miss schedule and cost targets.
Advanced operators further refine the calculation by measuring actual deposited weight on sample joints under shop conditions, then adjusting WFS or current to hit both productivity and metallurgical requirements simultaneously.
FAQs
What is a good deposition rate for MIG welding?
For 0.045-inch solid wire in spray transfer, 8–12 lb/hr is typical under production conditions. Higher rates are possible with larger wire or pulsed processes, provided heat input remains controlled.
How do you calculate deposition rate for flux-cored wire?
Use the same solid-wire formula with the manufacturer’s efficiency factor (usually 0.85–0.90) or measure deposited weight versus wire consumed on a timed sample weld.
Does higher deposition rate always mean faster welding?
Only if operating factor and travel speed keep pace. A high catalog rate at low arc-on time or restricted position can produce less actual weld metal per shift than a moderate-rate process with continuous travel.
What is the difference between deposition rate and deposition efficiency?
Deposition rate is the mass of weld metal placed per hour. Deposition efficiency is the percentage of filler metal consumed that becomes that weld metal; the remainder is lost to spatter, slag, or stubs.